Quick Start Guide
This quick start guide covers the basics to launch VisData, import data, import results, and compute metrics such as misses and false positives. If you have not downloaded the launcher yet, please follow the installation instructions.
Launch VisData
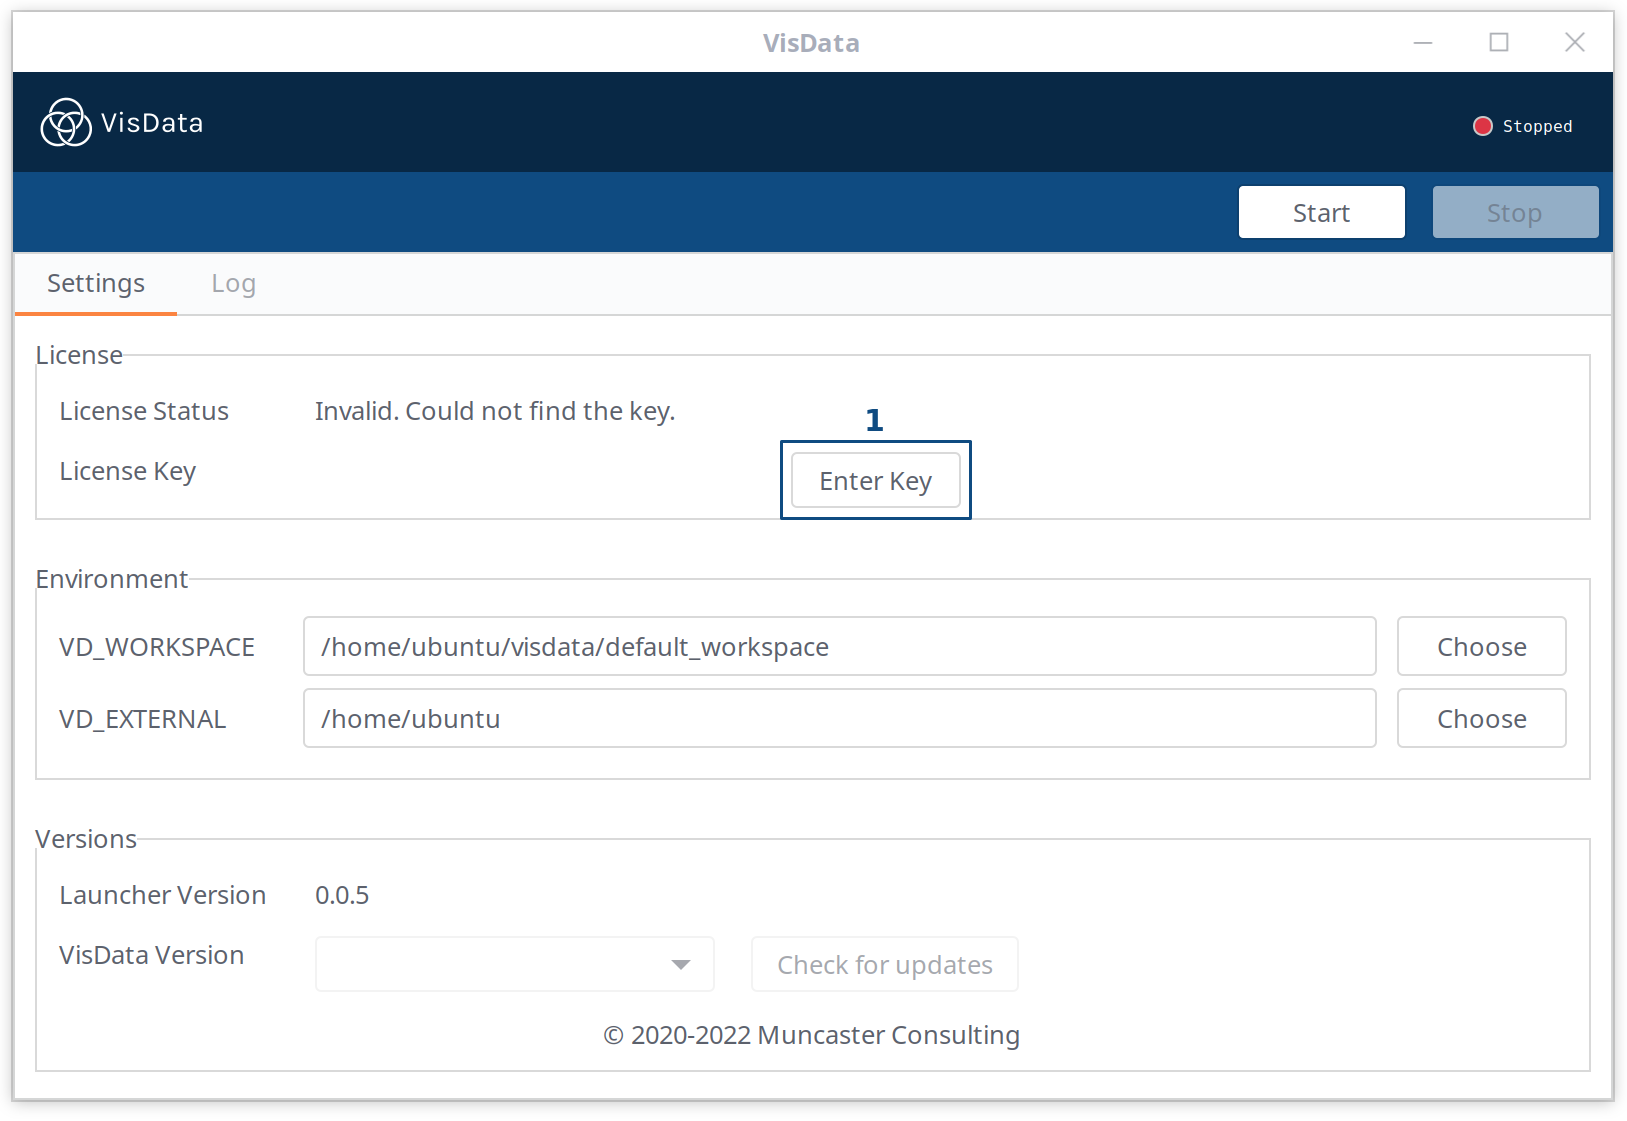
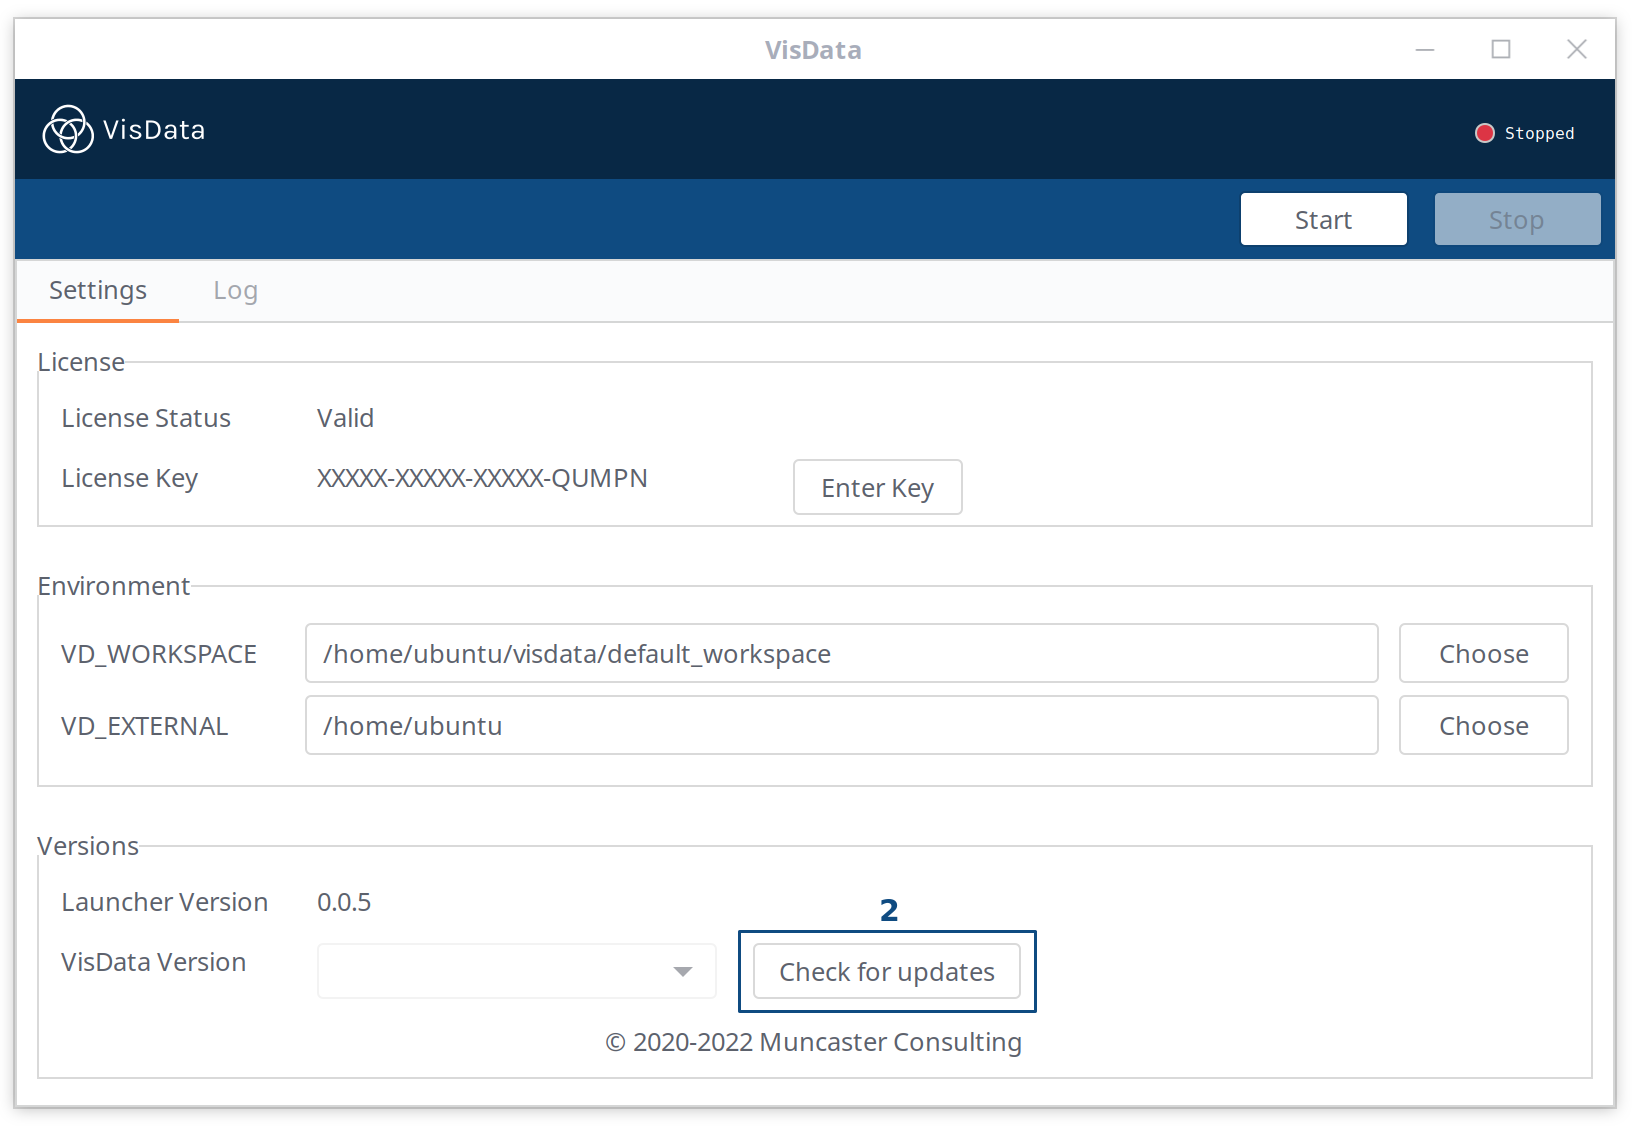
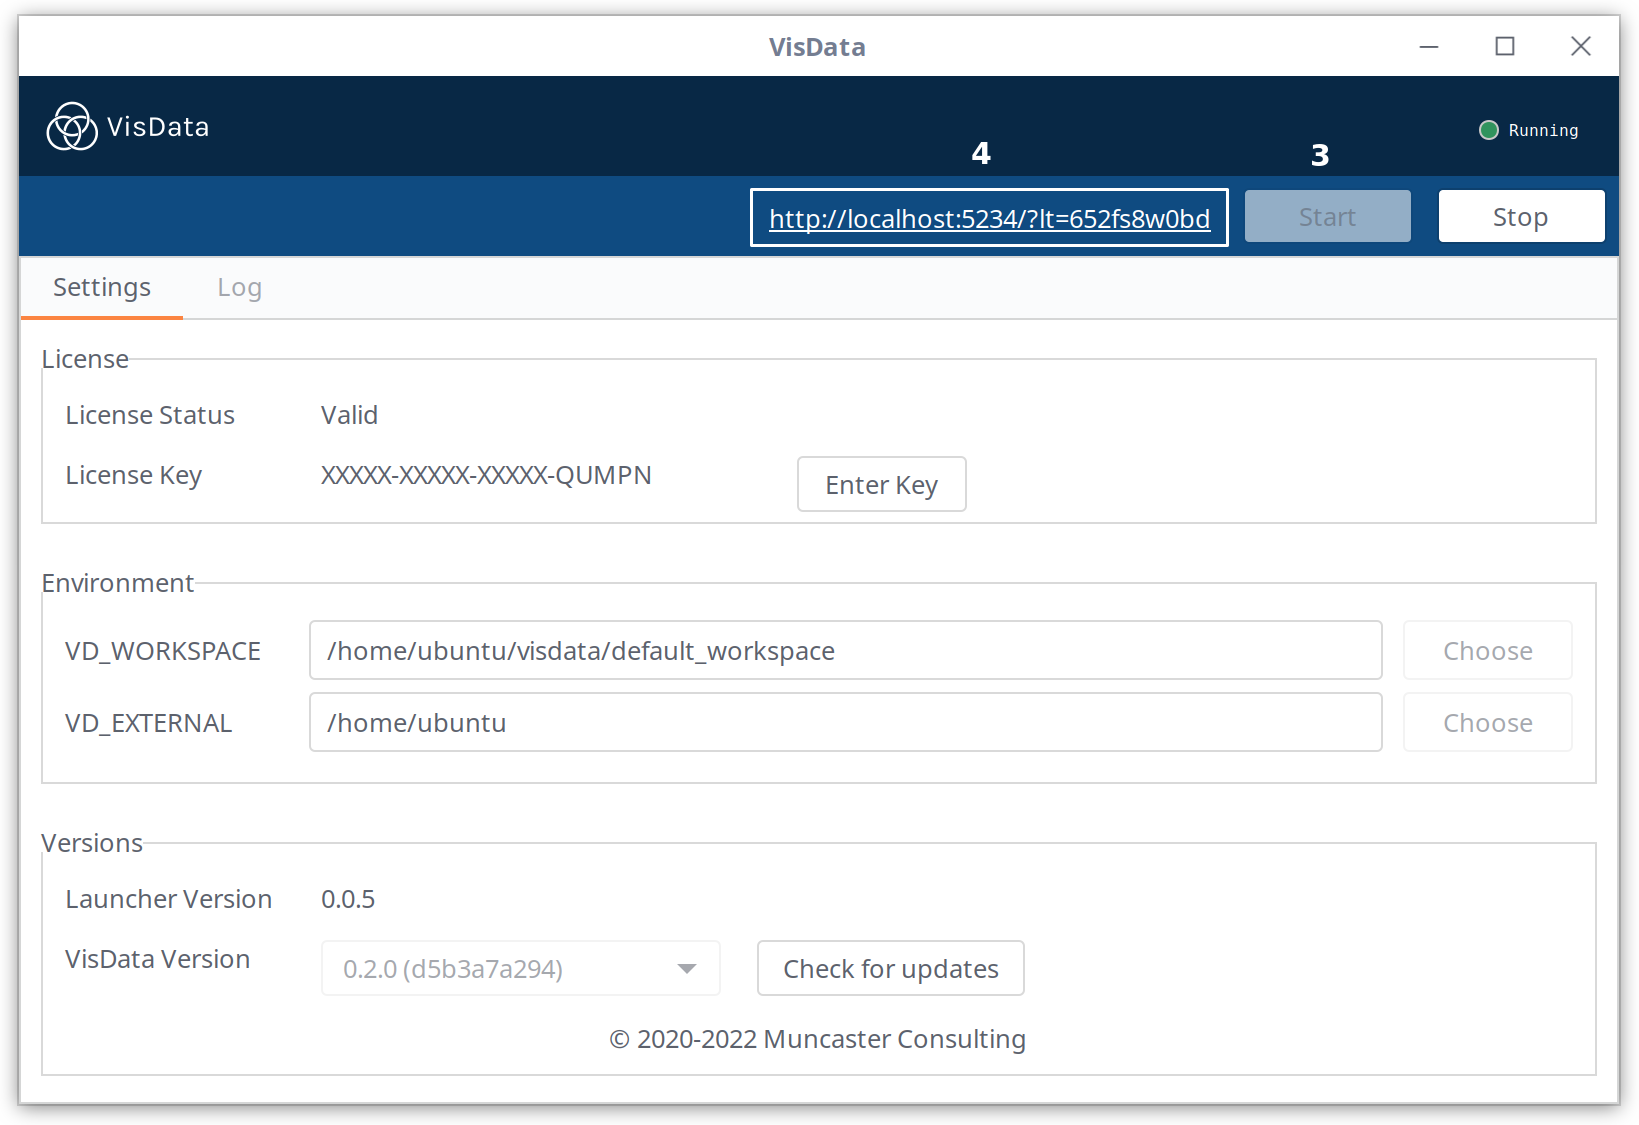
Open the VisData launcher from your applications menu. First, check that the license key is valid and correct. Next, check that the environment variable paths are correct and select the desired VisData version from the dropdown. Last, click start and wait a few seconds for a login link to appear. Click it to open the application on your browser.
Import Data
Start the 4-step import wizard by clicking the + Import New Data button on the top right corner.
This example uses the free Teledyne FLIR Visible & Thermal Dataset which includes annotated images and video in the COCO and Conservator formats.
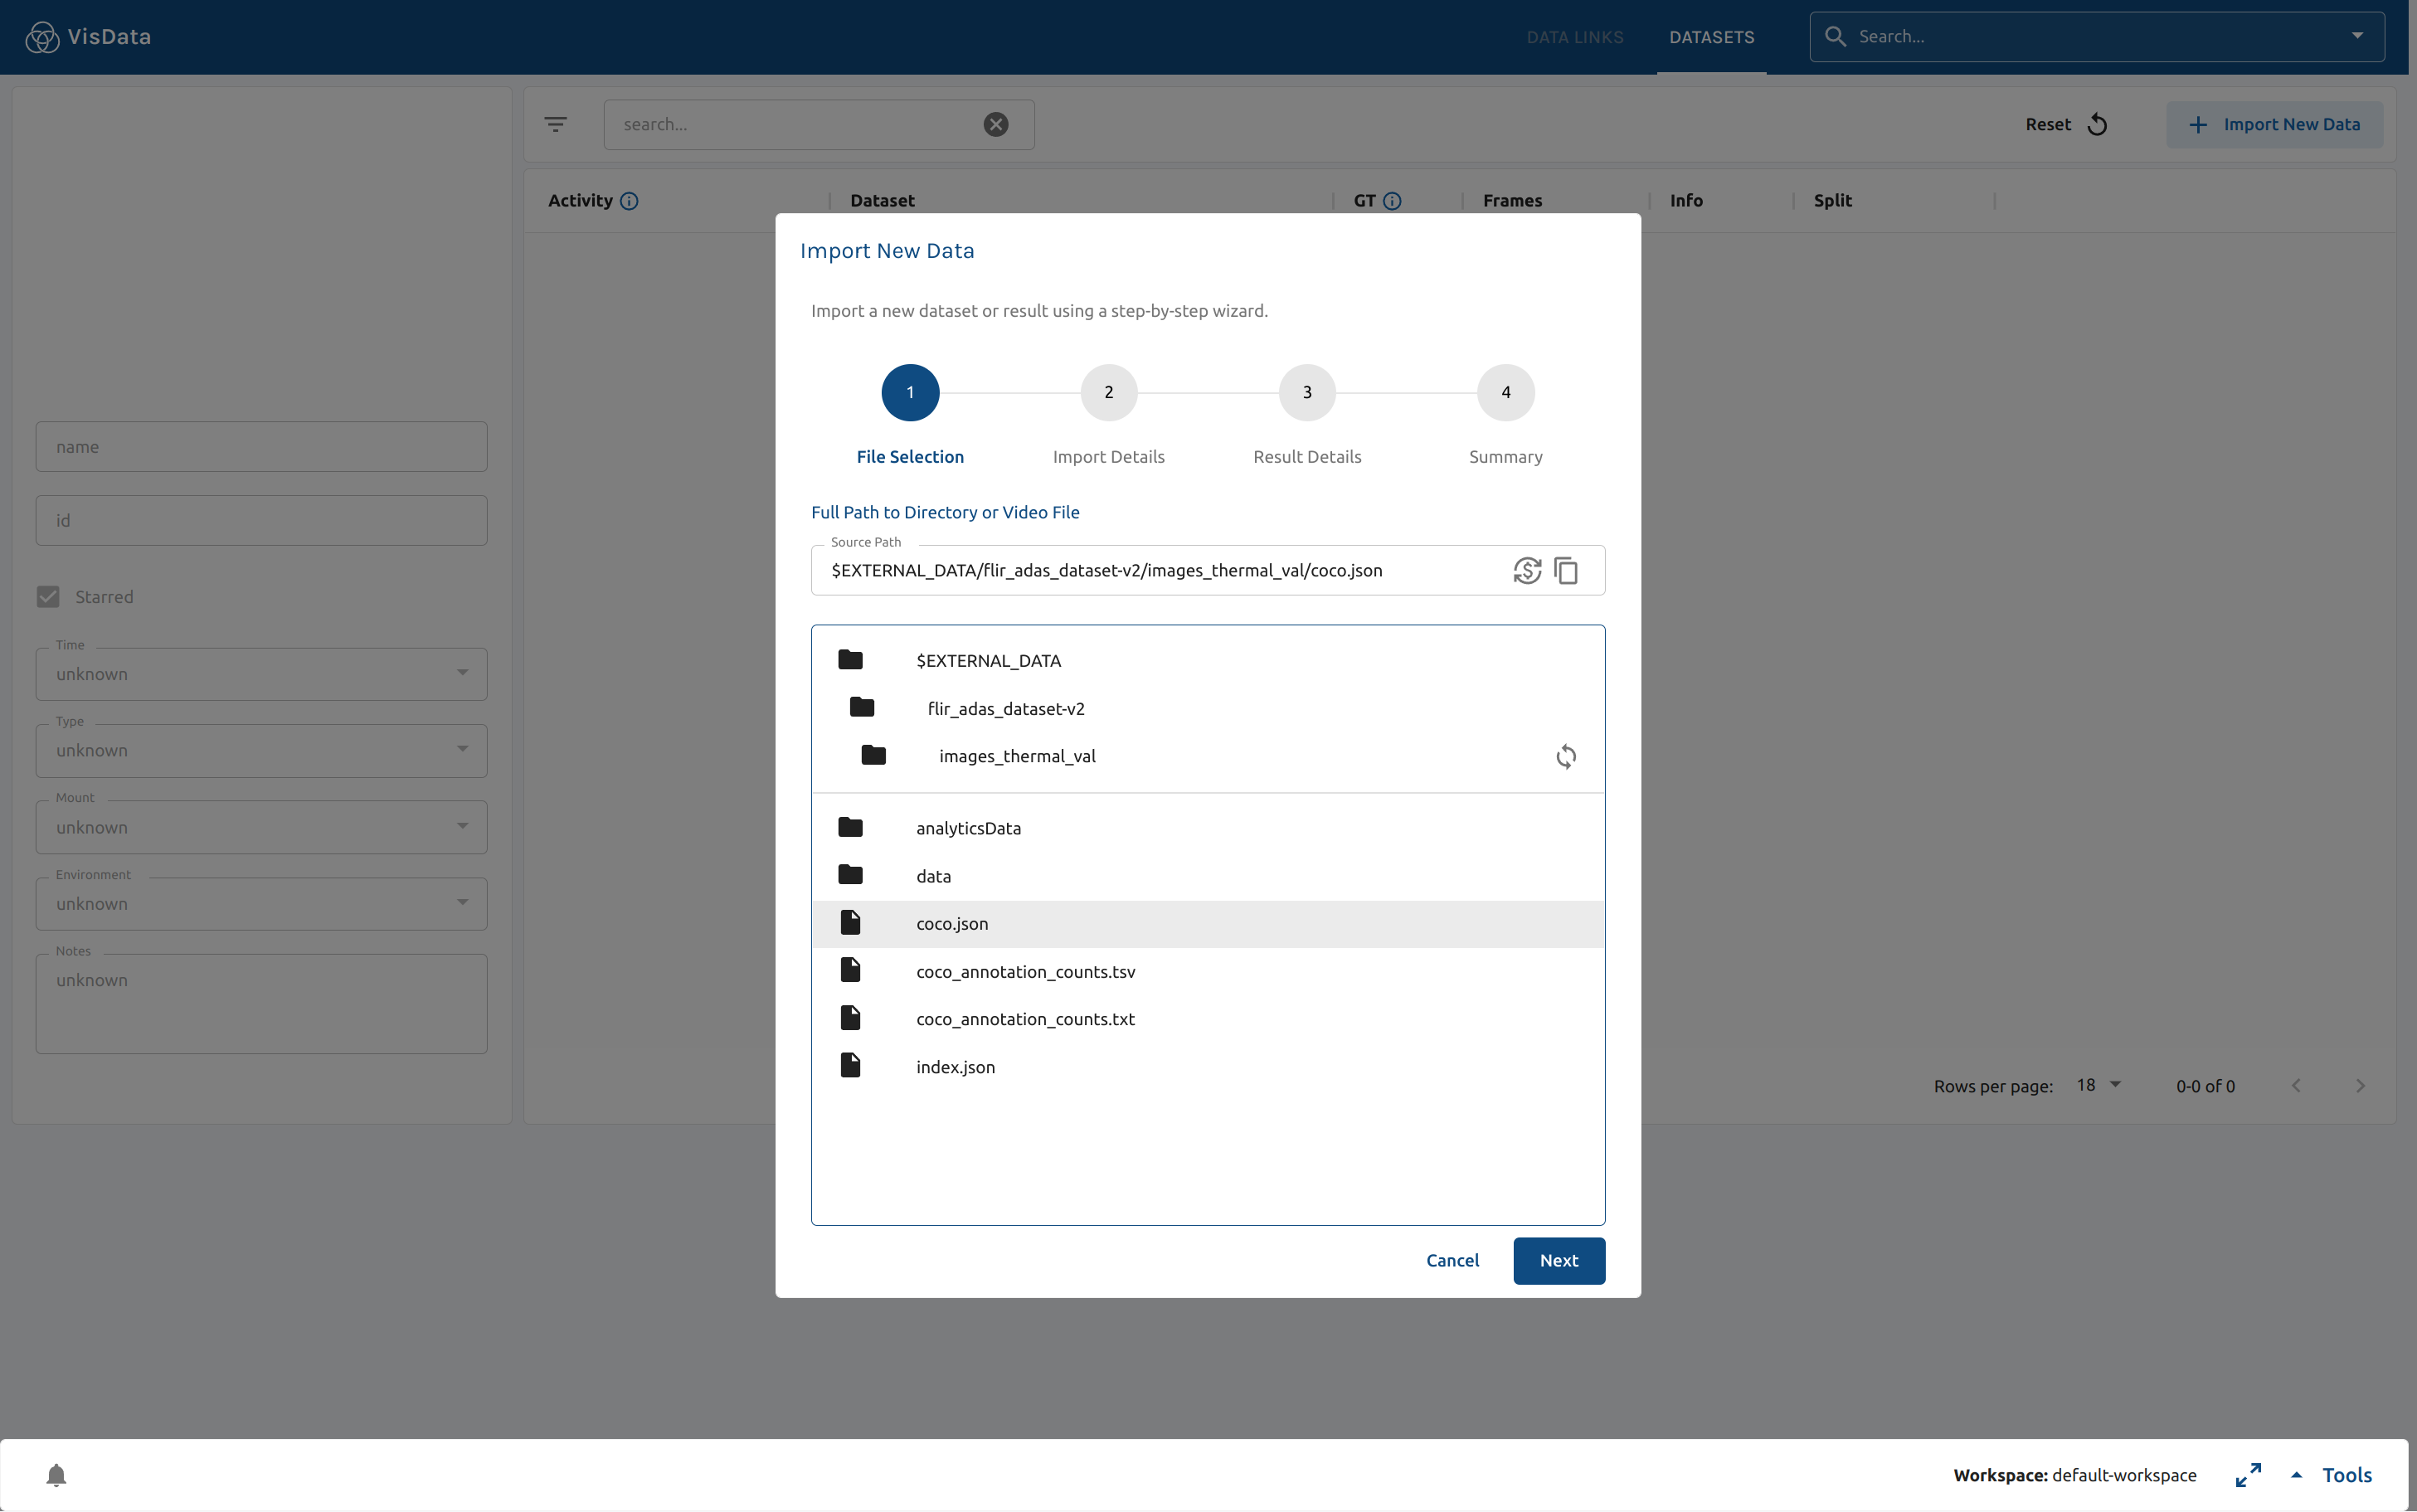
Navigate to the file or folder containing the dataset. This could be a video or folder containing images.
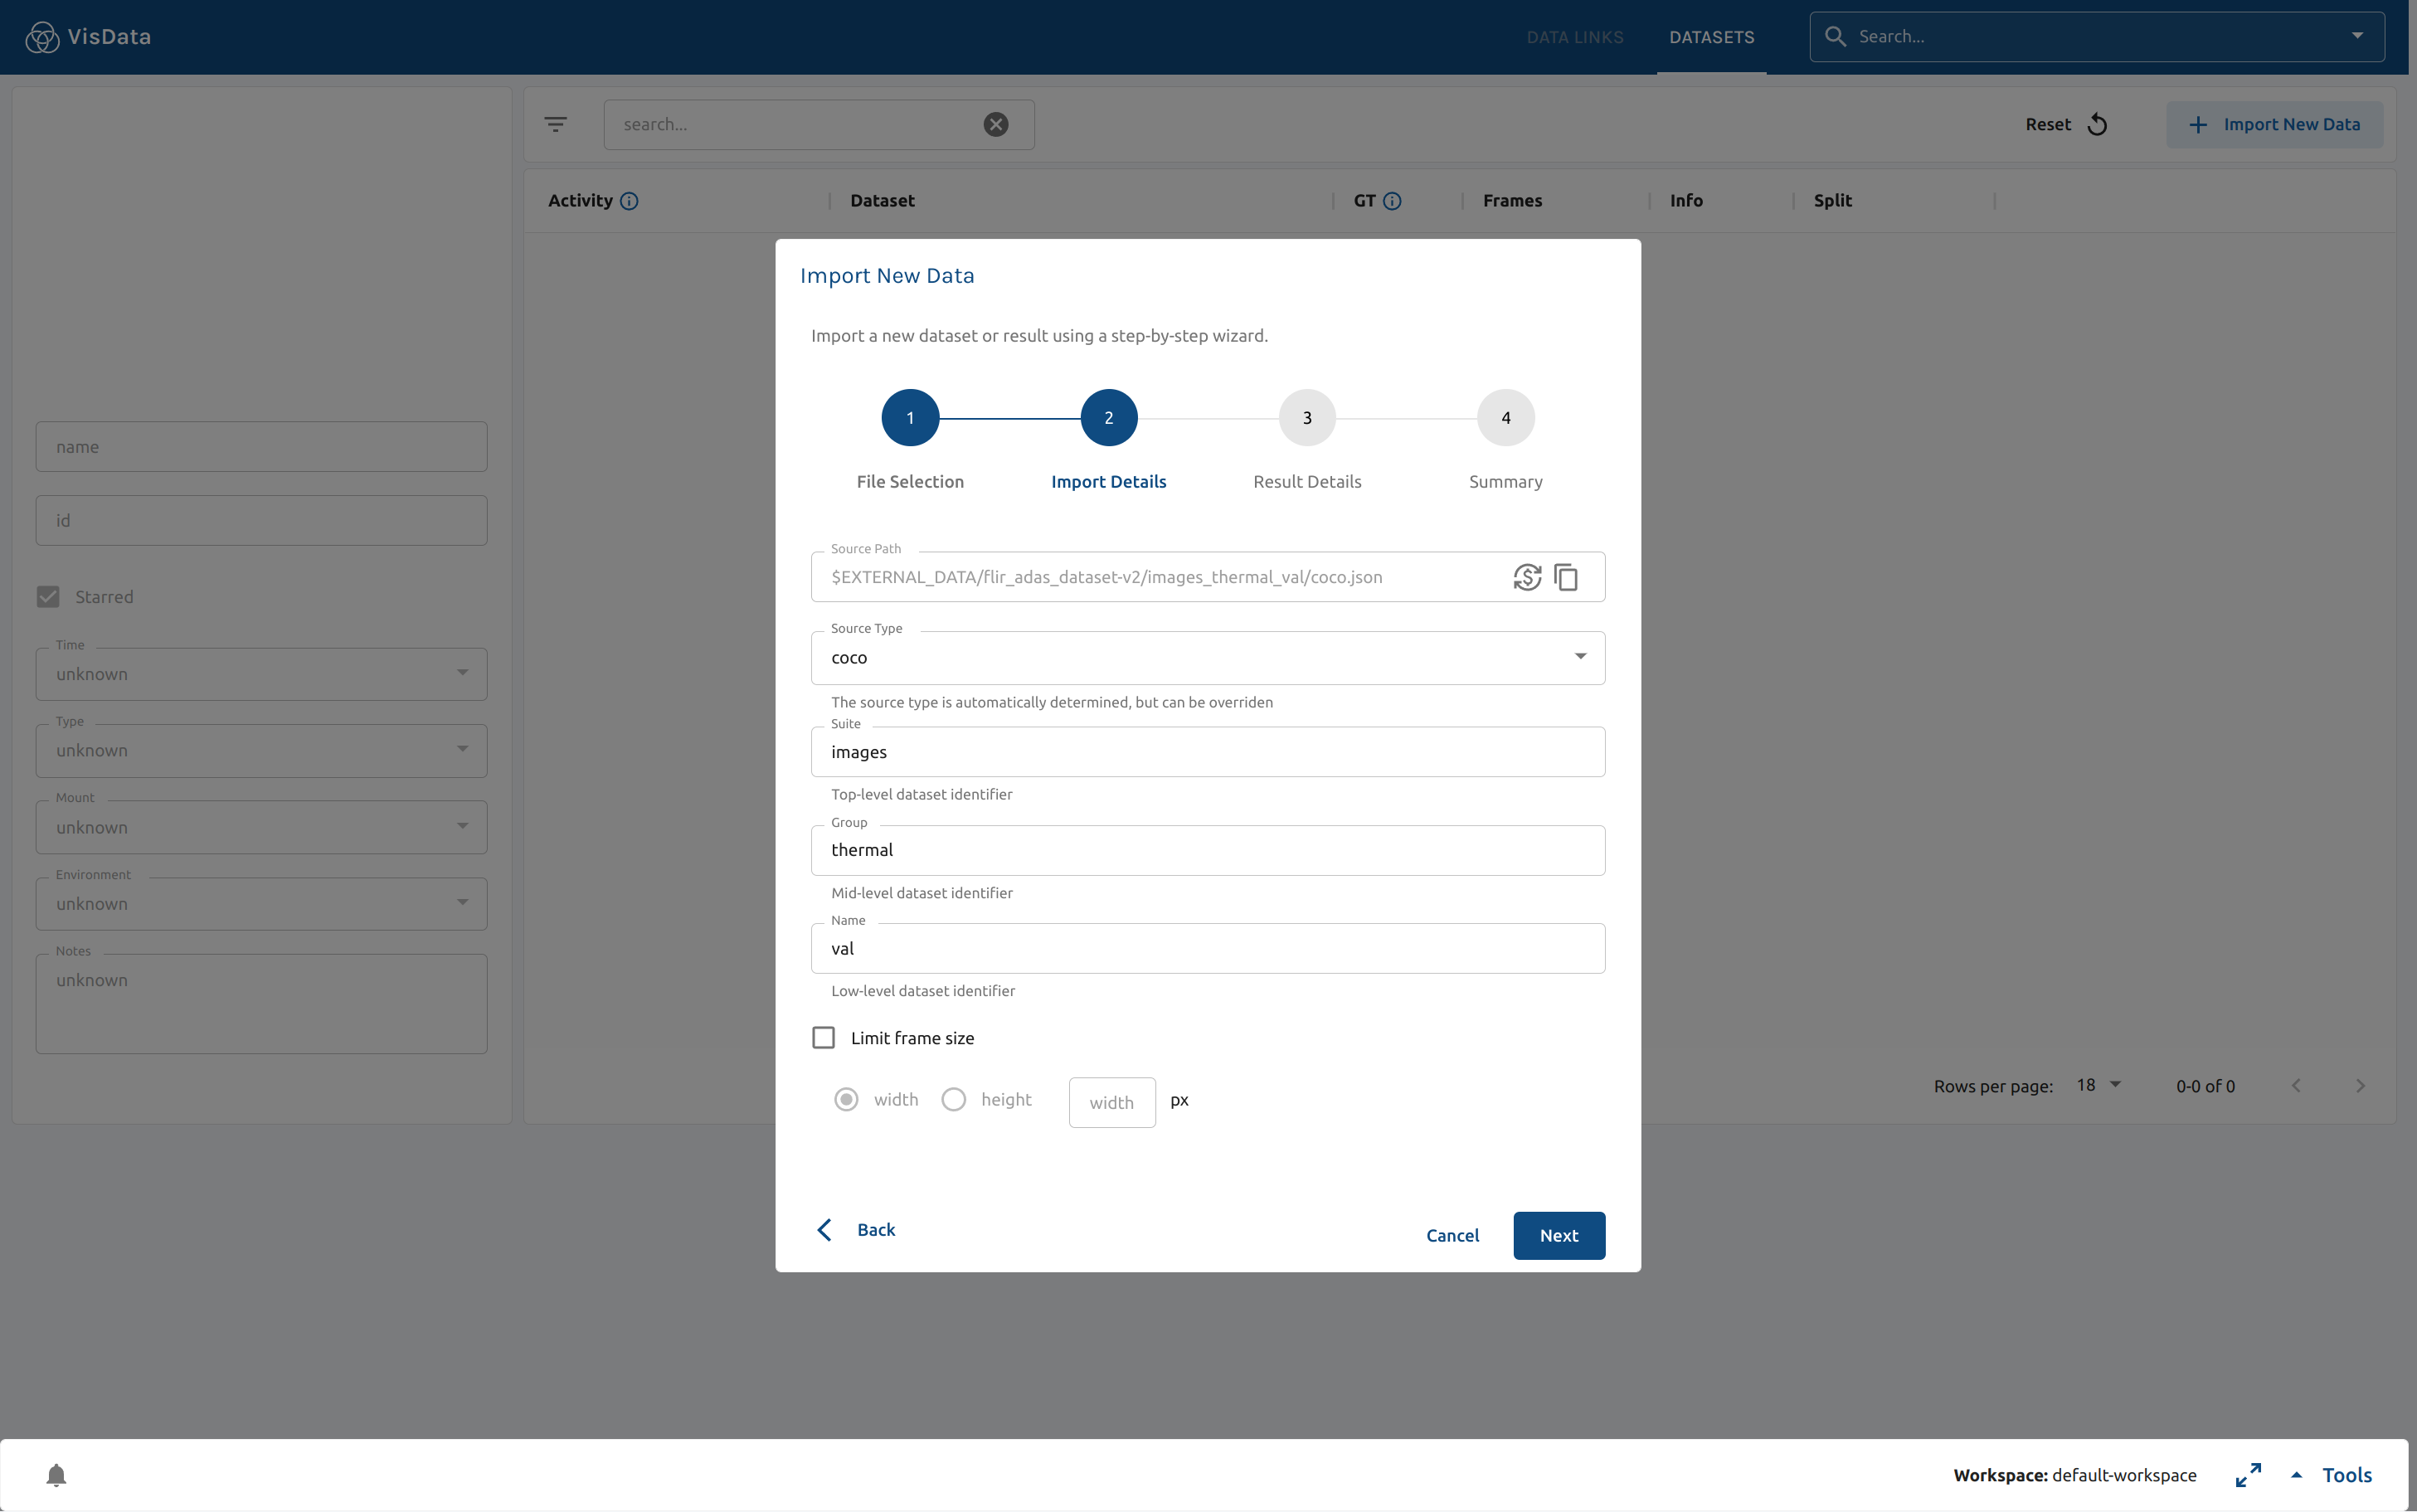
Fill out the import-details-form according to your dataset. Source type is automatically selected based on file selection but can be overwritten if needed. Suite, group, and name are dataset identifiers used to organize your workspace. Suite is the top level identifier, followed by group, and then name of dataset. Optionally you can set the limit frame size to a given height and width.
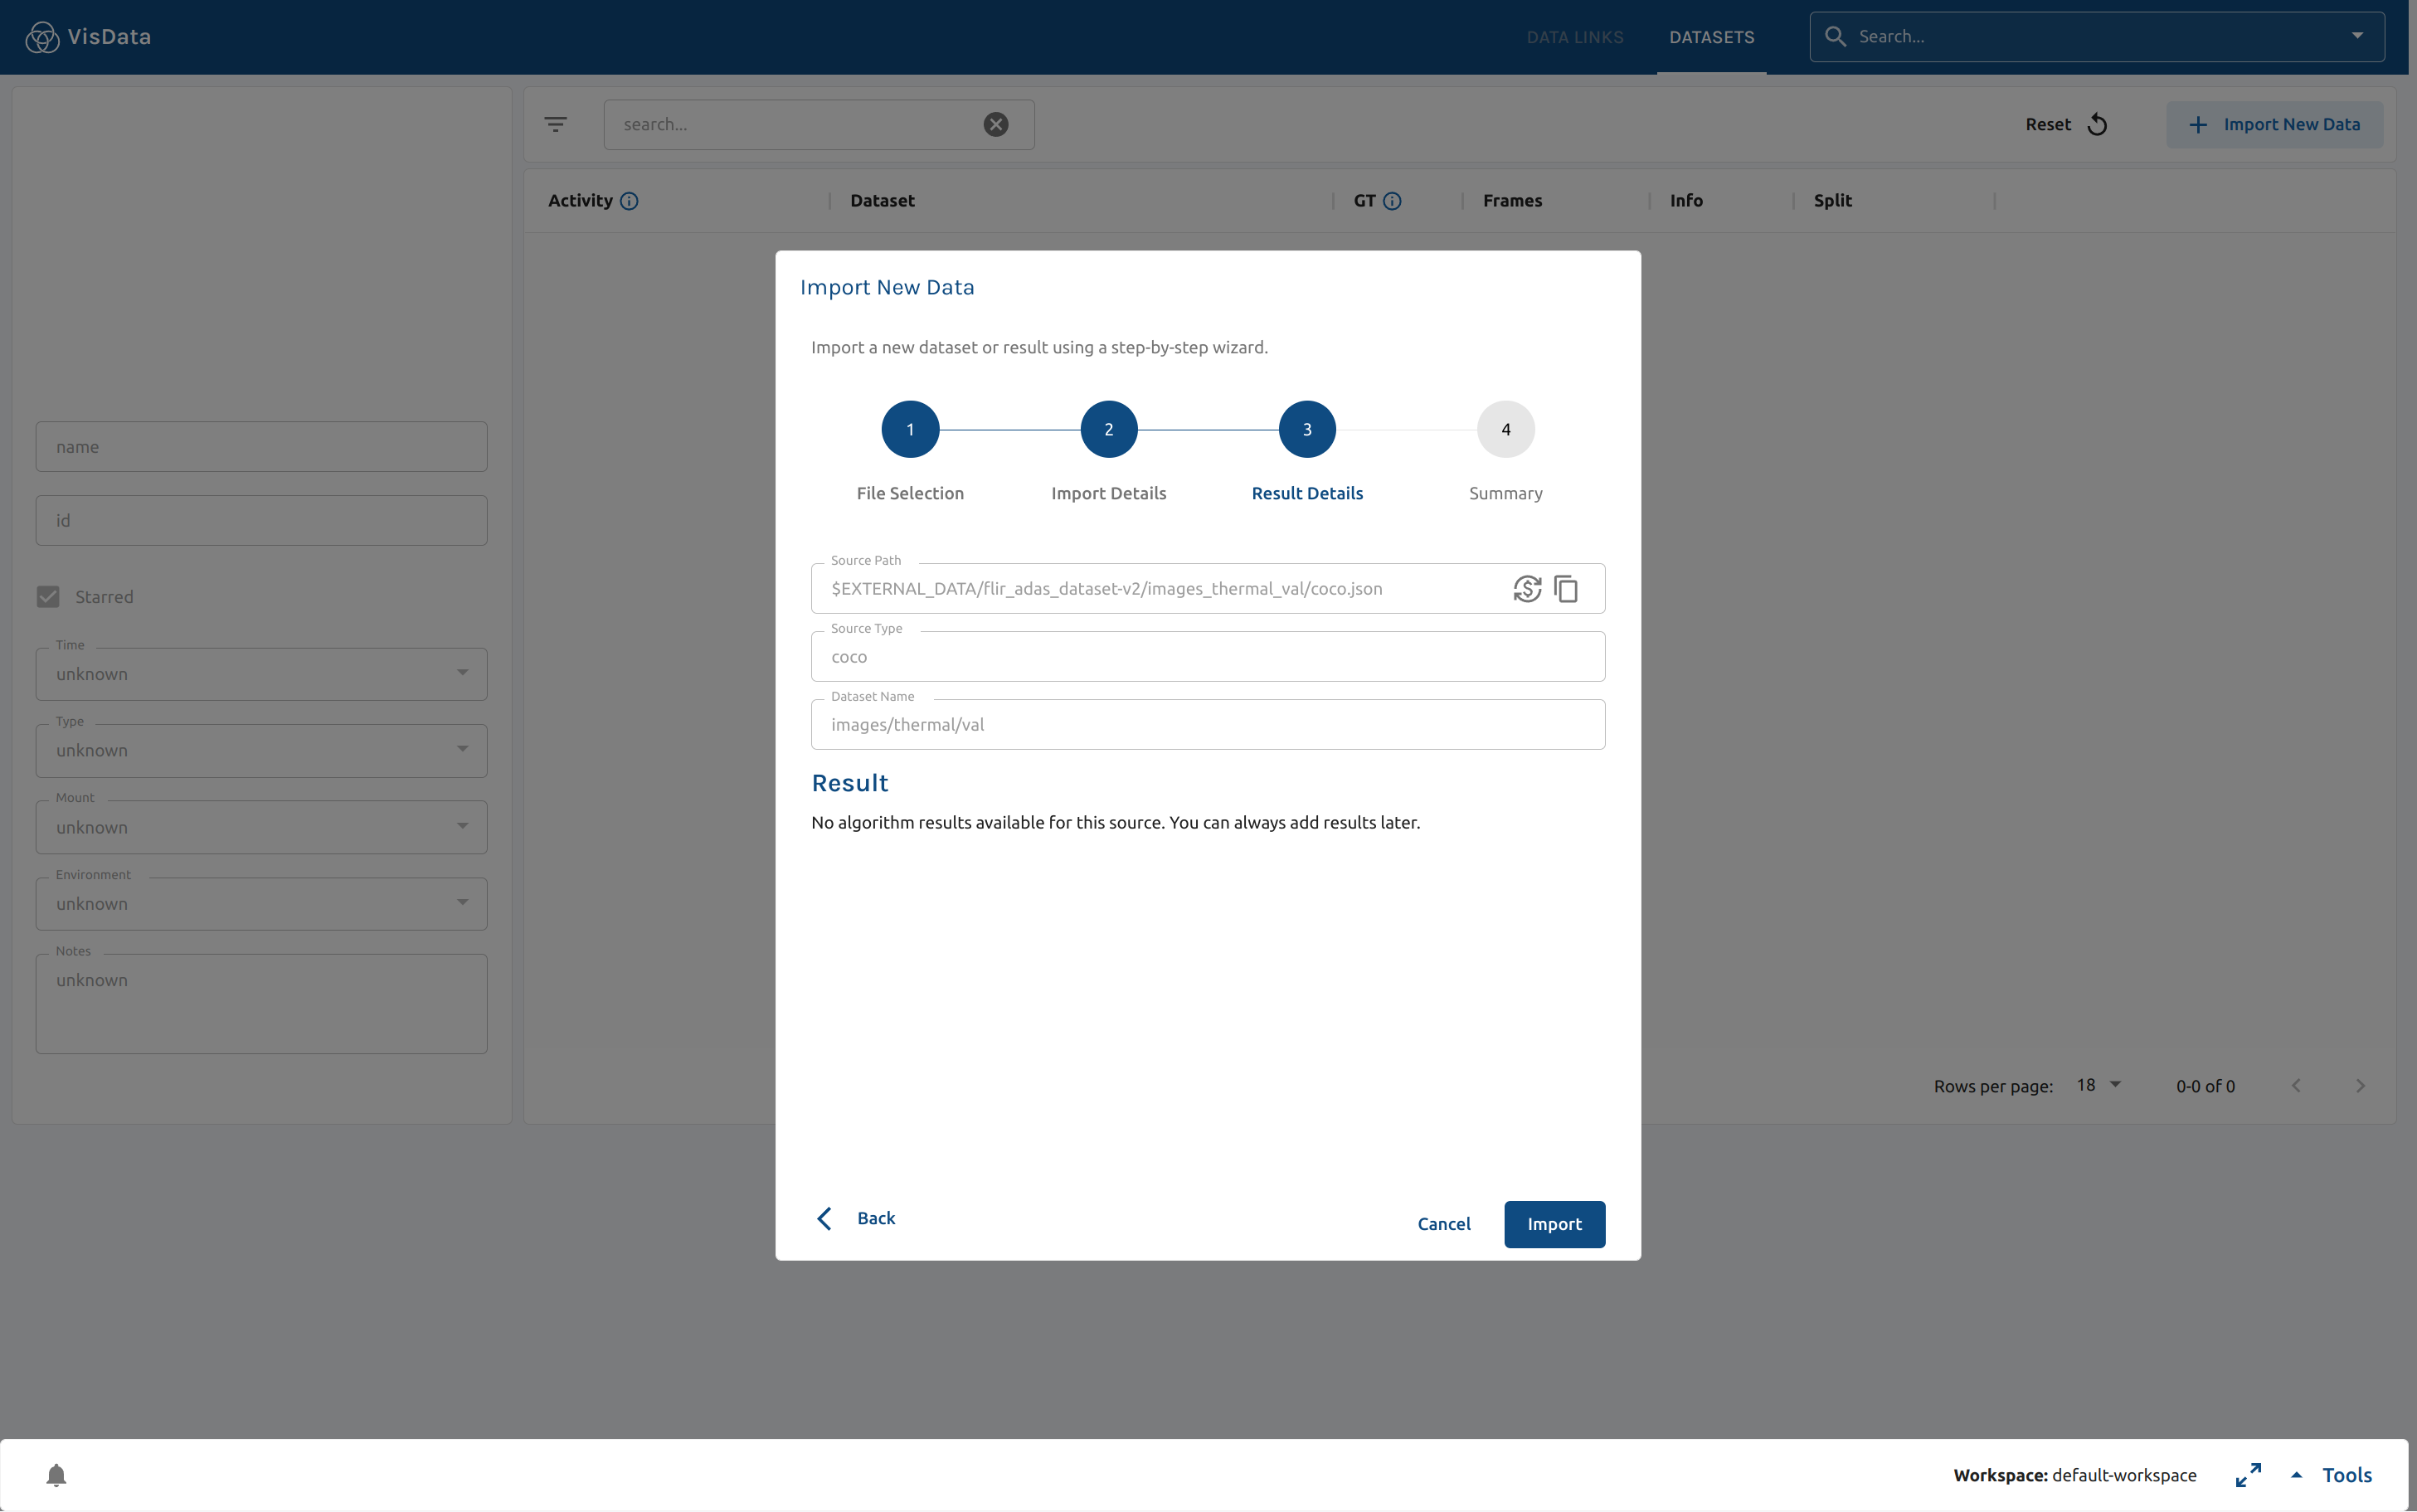
Import results if available, else you can import results later from the dataset view.
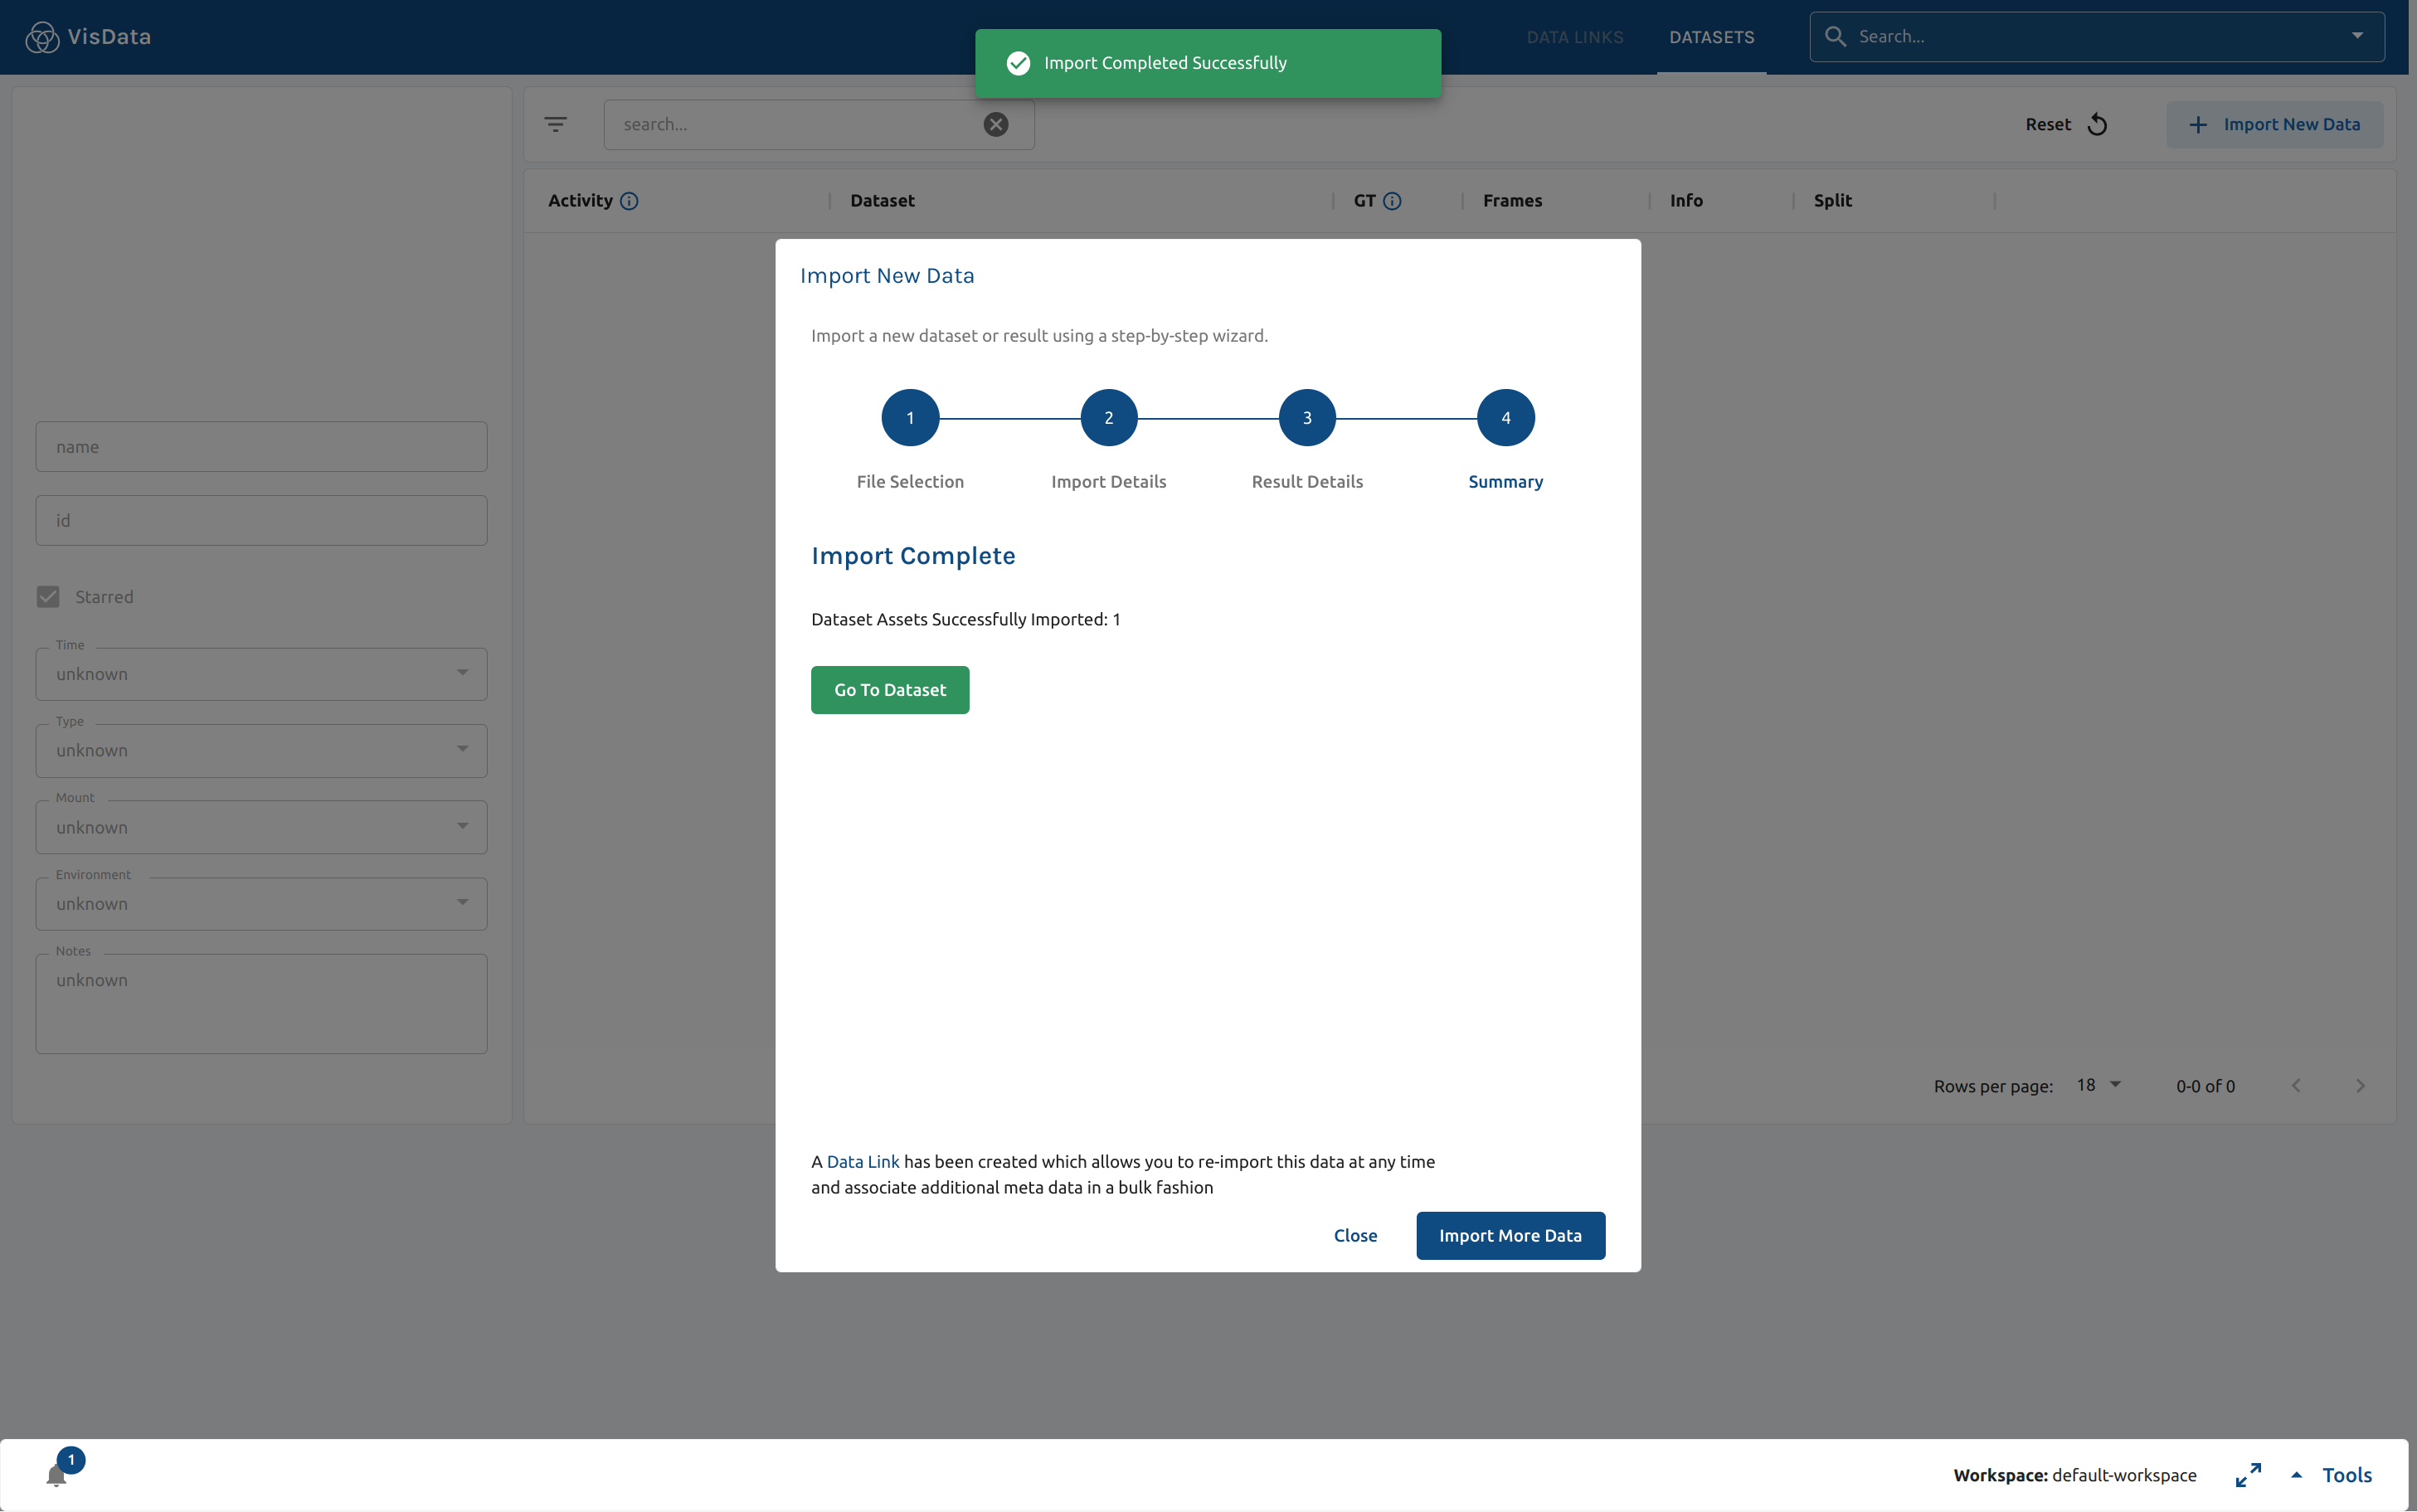
Import summary. Press "Go To Dataset" to view the imported data.
Import Results
VisData allows users to import and visualize multiple formatted detection in the same dataset with the help of a JSON file.
In dataset view, click edit -> Add/Modify Results and fill out the JSON file accordingly to import results. Clicking save,
creates a results-data-link which defines import behavior of (computer vision) results for a dataset.
The following is an example JSON file which configures import behaviour given specific attribute-value pairs.
Result with single detection layer.
{
  "RESULT_NAME": [
    {
      "color": "rgba(255,0,0,0.95)",
      "name": "Detections",
      "path": "$EXTERNAL_DATA/detections.json",
      "roi_key": "roi_d",
      "type": "formatted_detections"
    }
  ]
}
Result with two detection layers.
{
  "RESULT_NAME": [
    {
      "color": "rgba(255,0,0,0.95)",
      "name": "Detections",
      "path": "$EXTERNAL_DATA/detections.json",
      "roi_key": "roi_d",
      "type": "formatted_detections"
    },
    {
      "color": "rgba(0,255,255,0.95)",
      "name": "Tracks",
      "path": "$EXTERNAL_DATA/tracks.json",
      "roi_key": "roi_t",
      "type": "formatted_detections"
    }
  ]
}
See Result Data Link for detailed information about fields and supported formats for results.
Import generates a VisData-formatted result file which includes all detection bounding boxes organized by frames.
Result metrics including matches, misses, and false positives will be appended to this VisData-formatted generated file when computed.
Compute Metrics
One of VisData most powerful features is the ability to quickly find and visualize detection errors. This allows users to run a frame-by-frame analysis of their model and explore the source of misses and false positives. It is also a great tool for comparing per-class performance between different models or technologies.
In dataset view, click edit -> Compute Metrics and fill out the form according to the metrics you want to compute.
For details refer to compute metrics.
